intensityBoxPlot creates a boxplot for the Intensity data of a given
gene or feature, with optional subject-specific lines.
Details
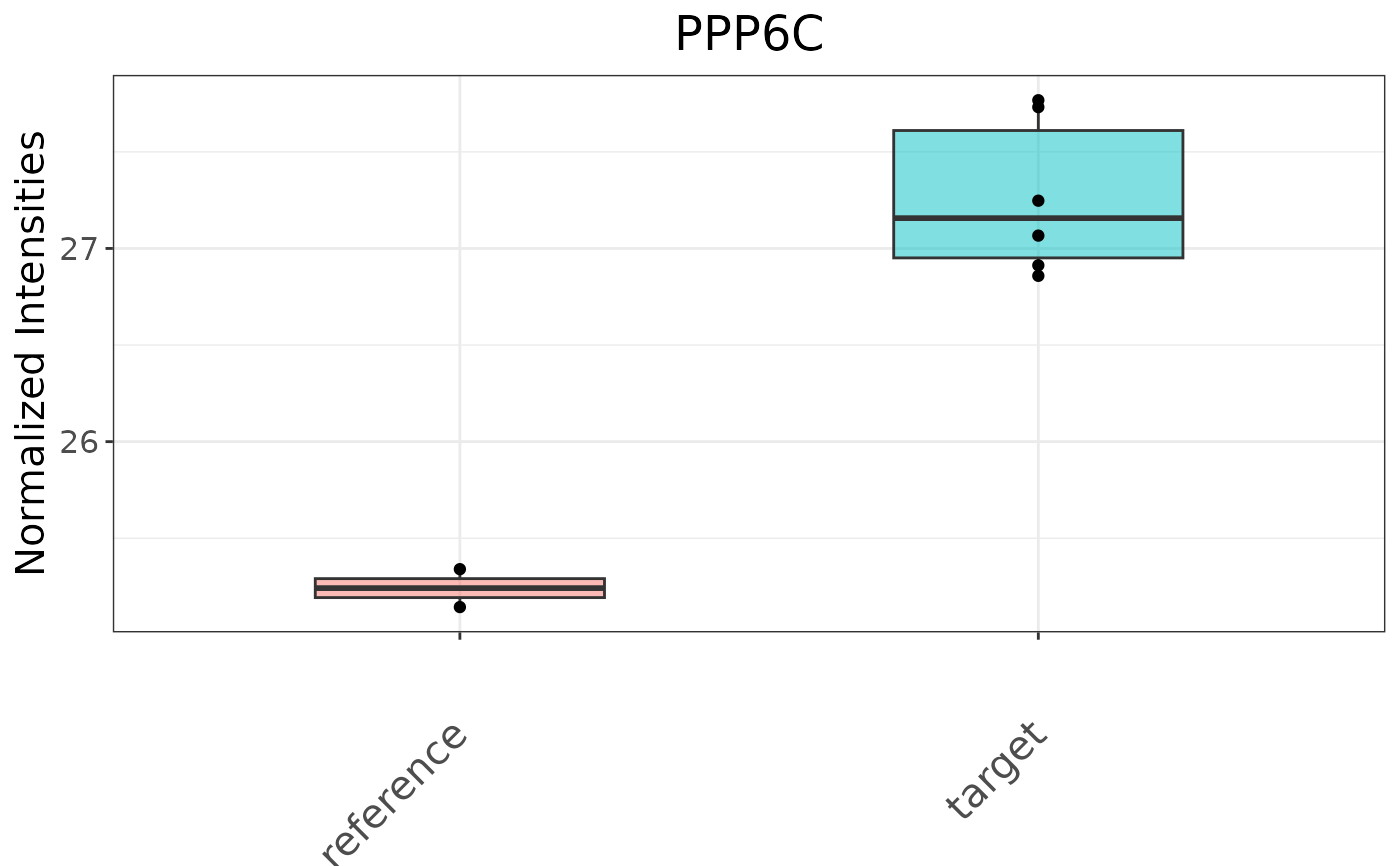
This function generates a boxplot for the intensity data of a specified gene
or feature from a SummarizedExperiment (SE) object. The plot shows the
distribution of normalized intensities across different groups specified in
the comparison column of the SE object.
The function can handle both grouped data and repeated measures:
- If the SE object does not contain a subjectID column, the function
plots a standard boxplot grouped by the comparison column.
- If the SE object contains a subjectID column, the function adds
lines connecting the points for each subject across the groups, providing a
visual indication of subject-specific changes.
The boxplot is customized with various aesthetic elements, such as box
width, transparency, point size, axis labels, and title formatting.
Examples
library(SummarizedExperiment)
# Load multiAssayExperiment object
data("dda_example")
# Get SummarizedExperiment object
se <- dda_example[["Proteome"]]
colData(se) <- colData(dda_example)
# Preprocess the proteome assay
result <- preprocessProteome(se, normalize = TRUE)
# Call the function to perform differential expression analyis
de <- performDifferentialExp(se = result, assay = "Intensity",
method = "limma", reference = "1stCrtl", target = "EGF",
condition = "treatment")
# Plot the box plot for the given id and symbol
intensityBoxPlot(de$seSub, "p99", "PPP6C")