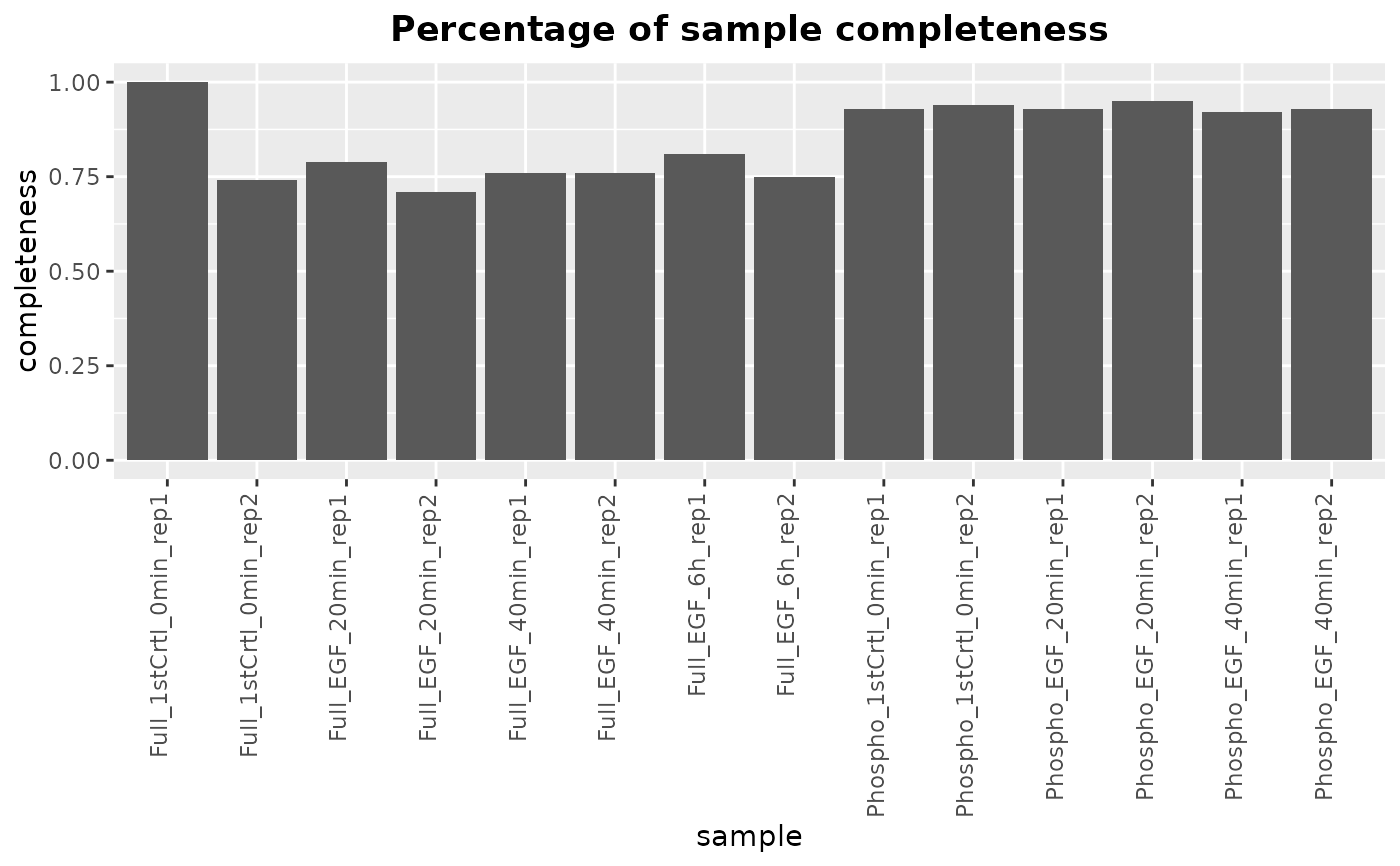
plotMissing generates a bar plot showing the completeness (percentage
of non-missing values) for each sample in a SummarizedExperiment
object.
Details
This function calculates the percentage of non-missing values for each sample
in the provided SummarizedExperiment object. It then generates a bar
plot where each bar represents a sample, and the height of the bar
corresponds to the completeness (percentage of non-missing values) of that
sample.
Examples
library(SummarizedExperiment)
# Load multiAssayExperiment object
data("dda_example")
# Get SummarizedExperiment object
se <- dda_example[["Phosphoproteome"]]
colData(se) <- colData(dda_example)
# Call the function
plotMissing(se)