Plot Log Ratio of PP/FP (Phosphoproteome to Full Proteome) intensities
Source:R/normalization_correction.R
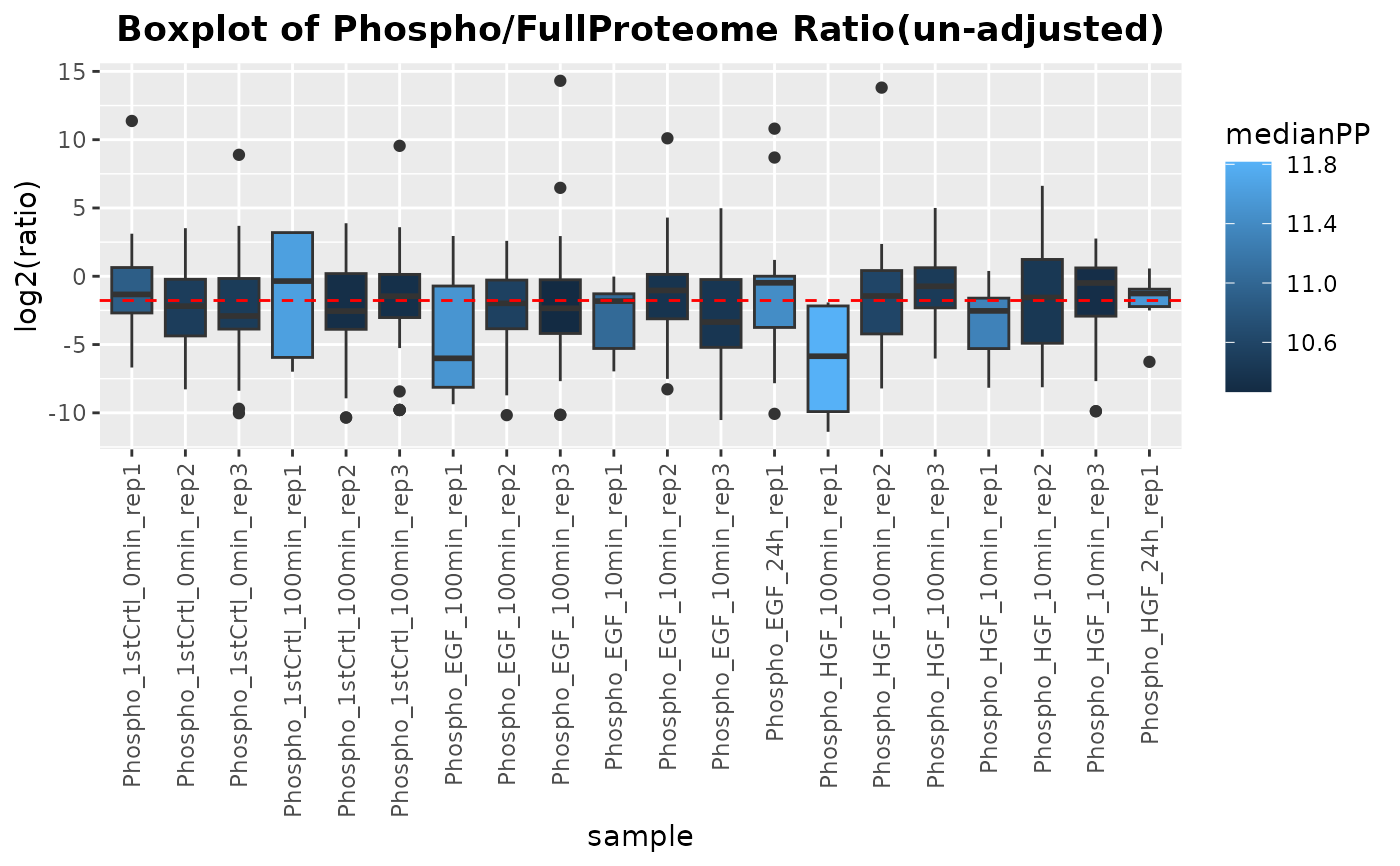
plotLogRatio.RdplotLogRatio generates a boxplot of the log2 ratio of intensities of
phosphoproteome to full proteome data from a MultiAssayExperiment
object.
Examples
# Load multiAssayExperiment object
data("dia_example")
# Call the function
plotLogRatio(dia_example, normalization = TRUE)